
This article will show you how to interpret the topography to work out the slope of the property and check the elevations on each corner of the design.
The contours that are found in canibuild are generated using LiDAR technology - (Light Detection and Ranging) .
 |
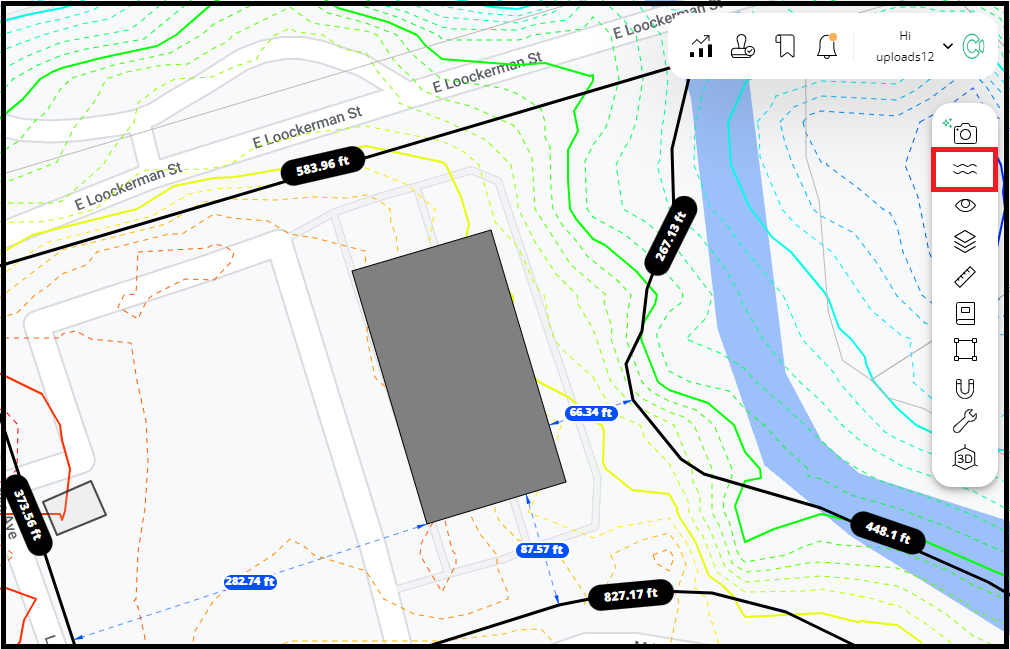
Toggle Contours Icon - Turns on the range of coloured contour/topography lines that show the slope of the property. |
 |
Turns on the structure elevations - Measurements on each corner of the design that show the levels. |
How to check the slope of the property?
- Select the Toggle Contours icon on the right hand tool bar.
- Each contour line will have a number or RL on it. This is the height from sea level.
- The colours make it easy to quickly interpret the change in elevation across the site.
Red is the Highest Point on the property
Blue is the lowest point on the property
Solid lines show a change in elevation of 5 ft
Dotted lines show a change in elevation of 1ft

When the contours are turned on, a notification will appear to display the validity of the contours. These can be:
- Pre-existing contours, high confidence.
- Pre-existing contours, low confidence.
- Proposed contours (Proposed by the developer for a new subdivision).
- Contours unavailable.

If contours are unavailable, a notification will appear at the bottom of the screen, which typically occurs in new subdivisions. Should you obtain a copy of the contour survey from the developer, please submit a request, and our team will be happy to upload it for you.

Any proposed contours that deviate from the standard increments will be represented by solid orange lines.

How to understand the structure elevations
- Left click on the design.
- Select the Structure Elevations icon from the pop up menu.

The structure elevations display change in height on all 4 corners of the structure.
- The Green point is always A - This is the highest level of the design.
- Each of the Blue points show the decrease in height from point A.

- Clicking on the letters will reveal extra information.
- NGL - Natural Ground Level
- FFL - Finish Floor Level

The 0 value in point A can be edited. By adding 1 it would update the FFL to include the foundations.