Utilities
Coloured lines surrounding or crossing the property indicate the location of underground or aboveground utilities. These typically include sewer, stormwater, water supply, and electrical services.
- Red / Pink - Sewer Lines
- Dark Blue - Storm Water
- Light Blue - Fresh Water
- Yellow / Green - Electrical

Not all utilities are available for every property. The visibility of utility data depends on information supplied by our third-party data providers. If you're unsure about a specific site's utility data, you can submit a support request for further investigation.
Contours
Contour lines represent elevation changes across the property. These are colour-coded to help you quickly identify the slope of the land.
-
Red – Highest point on the property.
-
Blue – Lowest point on the property.
-
Solid Lines (ANZ) – 1 metre elevation change.
-
Dashed Lines (ANZ) – Submetre elevation changes.
-
Solid Lines (US) – 5 foot elevation change.
-
Dashed Lines (US) – 1 foot elevation change.

If contour data is proposed by a developer, the lines may not follow the standard colour spectrum and will appear in uniform orange.
- These contours are Orange

Contour intervals typically range between 200mm, 500mm, or 1000mm. To check the elevation at a specific point, place a design on the property & refer to the elevation arrows.
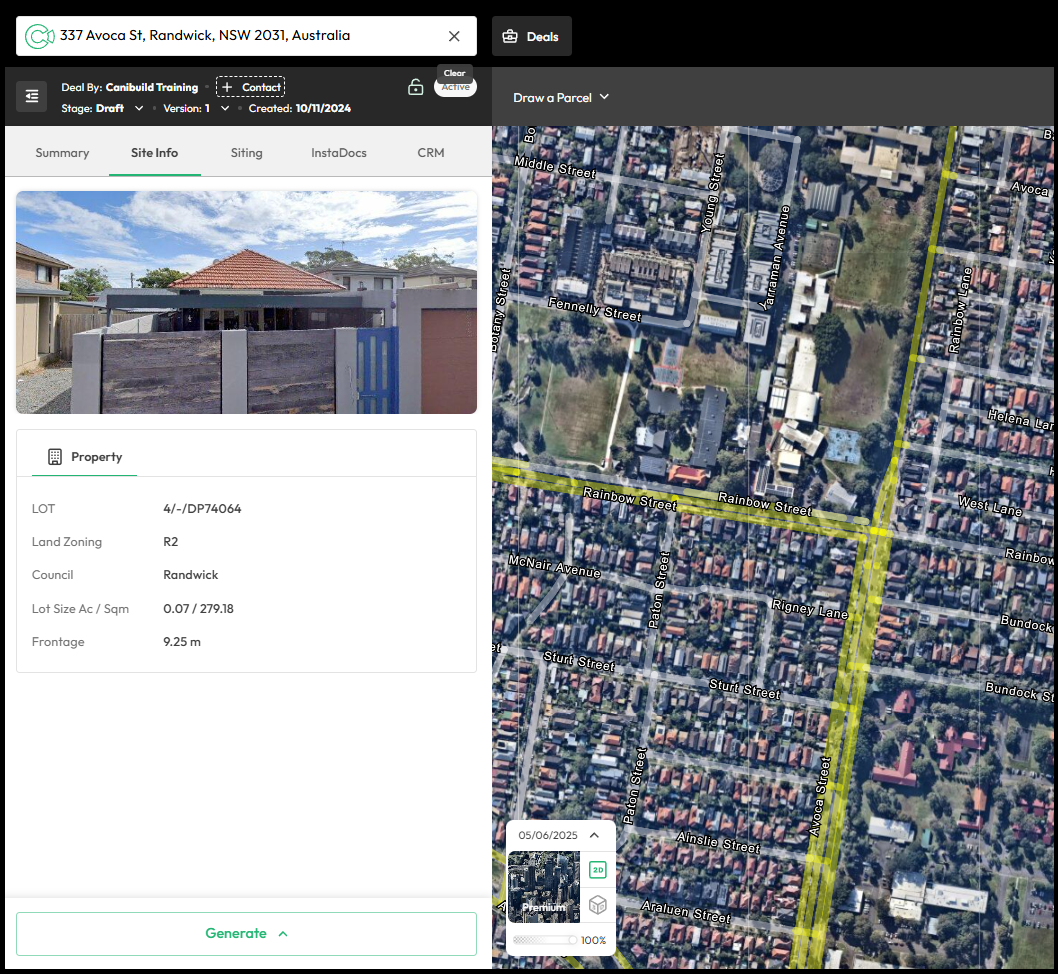
Roads
The map view may also highlight roads with different colours to indicate their type or traffic level.
-
Orange – Highways.
-
Yellow – Major streets or roads.
-
Grey – Standard residential streets.