
This article will show you how to maximise your canibuild account by collecting the data to help you analyze the overall usage, most popular designs, most common regions, best sales consultant, and most active housing estates.
The canibuild application is made up of a range of different data sets. The Analytics feature collates this information so it can be used to enhance sales and marketing.
- Click the Analytics icon on the top right of the screen to access the feature.

The map will graph all searches completed within the app in the selected time frame. There are also multiple graphing options to choose from.
- Click Current year to select the overall time frame.
- Click Months to select the unit of measurement.
- Click the vertical bars to select a specific time frame.
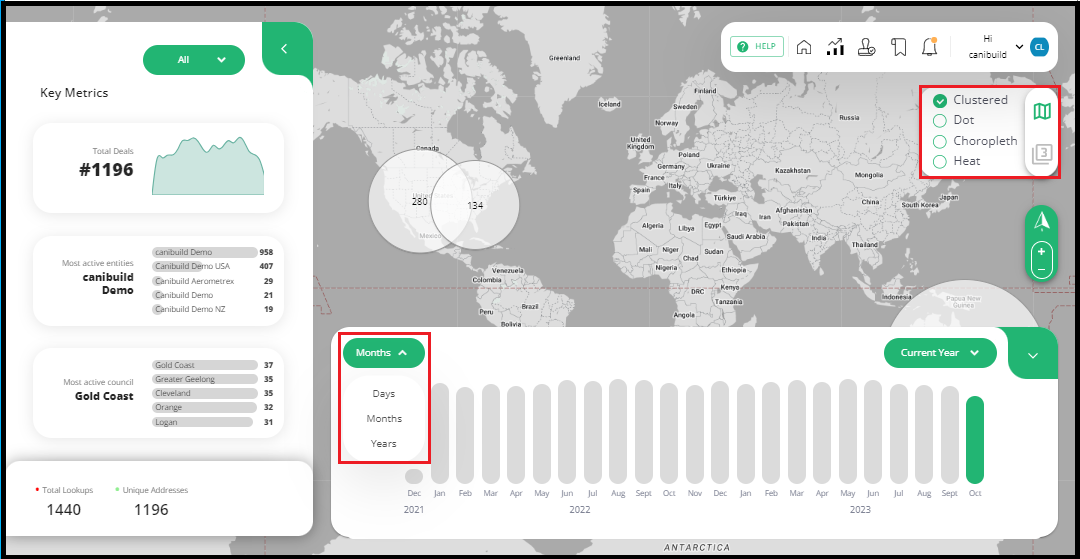
There are 7 key metrics that are collated from the application:
- Total number of deals of the selected time frame.
- For multiple franchises this shows total split of property searches across account.
- The council area that most of the searches or quoted jobs were in.
- Shows the sales consultant with the most leads in correlation to searches.
- The housing estate or subdivision that was most searched.
- The design that was requested/sold the most.
- The most common document ordered from marketplace.
Clicking on each of these will expand the tab for the complete data set.

- Click the Home icon to exit.
